Showing posts with label useful resources. Show all posts

Monday, February 6, 2012

Using apply() to create a unique id

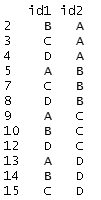
Suppose you have a data set with two identifiers. For example, maybe you're studying the relationships among firms in an industry and you have a way to link the firms to one another. Each firm has an id, but the unique unit in your data set is a pairing of ids. Here's a stylized example of one such data set:


In the example that motivated this post, I only cared that A was linked with B in my data, and if B is linked with A, that's great, but it does not make A and B any more related. In other words, the order of the link didn't matter.

In this case, you'll see that our stylized example has duplicates -- id1 = "A" and id2 = "B" is the same as id1="B" and id2 = "A" for this purpose. What's a simple way to get a unique identifier? There's an apply command for that!

Thinking of each row of the identifier data as a vector, we could alphabetize (using sort(), so c("B", "A") becomes c("A", "B")), and then paste the the resulting vector together into one identifier (paste, using collapse). I call our worker function idmaker():
idmaker = function(vec){
return(paste(sort(vec), collapse=""))
}
Then, all we need to do is use the apply command to apply this function to the rows of the data, returning a vector of results. Here's how my output looks.


To get a data frame of unique links, all we need to do is cbind() the resulting vector of indices to the original data frame (and strip the duplicates). Here's some code:

co_id = apply(as.matrix(df[, c("id1", "id2")]), 1, idmaker)
df = cbind(df, co_id)
df = df[!duplicated(df[,"co_id"]),]

Here is the resulting data frame with only unique pairs.


Monday, July 18, 2011

Avoiding Loops in R: An Example with Principal Minors

Yesterday, I found myself wanting to compute a large subset of the second order principal minors of a matrix (diagonal-preserving minors; the ones for which the rows and columns kept are the same). Don't judge me for wanting to do this, and bear with me, there is a lesson about R programming here (mostly for me, read the comments for testing).

If you don't know what a principal minor is or forgot what it was (because most of us don't spend much time with principal minors), here is a short refresher on how to get a second-order principal minor (other orders are possible and there's a lot of related theory, but let's try to focus on this one task for now).

Step 1: Deletion. Take any matrix. Delete all but two rows and all but two columns. For example, suppose the matrix is 5x5 and let's keep rows 1 and 3 and columns 2 and 4 (lots of other combinations are possible).

In the back of your mind, think how easy this is in R.

Step 2: Calculation. Once we delete the irrelevant parts of the big matrix to get our 2x2 submatrix, obtain the principal minor by taking the determinant of the resulting 2x2 matrix. For our example, we compute 3x2 - 3x1 = 3.

Both steps in this calculation are easy to implement in R. For the first step, merely use R's fantastic syntax for extracting rows and columns of matrices. If the matrix is called mat, we efficiently perform the first step by:

little_mat = mat[c(1,3), c(2,4)]

That's easy enough. With little_mat in hand, the second step is even easier.

pm = det(little_mat)

The real trick to this programming problem is picking out all of principal minors I want to compute (diagonal-preserving ones that keep the same-numbered rows and columns; little_mat won't do because c(1,3) is not c(2,4)), and doing it efficiently. I also don't want to rewrite my code as my matrix changes size.

So, what do we do? A really bad An idea that will eventually compute the right answer is to write this using for() loops.


Barring a coding error, this code should eventually work, but it will be slow (or fast depending on how you write it). If you want to run through this code many times (like I did yesterday), efficiency is at a premium and you should immediately think of faster techniques -- like using the apply() function (or preallocating your storage vector, which actually saves time).

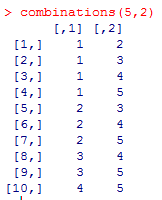
Before moving to apply(), we need a quick way to enumerate all of the ways to keep two out of N rows. If we were counting, that's N choose 2, also known as a combination. Fortunately, this step has already been implemented in the gregmisc library with a function called combinations(). Conveniently, combinations(N, 2) will return a matrix with all of the ways to select two numbers less than or equal to N as its rows. There are other options, but this is the default, which is perfect for our application.

For example, here is some output for N=5.

With this way of computing the rows/ columns we want to keep, all we need to do is put our simple code for computing a second order principal minor into a function. Let's call it minor2(). Then, use apply() to apply this function to each row (MARGIN=1 is for rows) of the combinations matrix. Here's the complete set of code that will work if you have a matrix called mat for which you want the diagonal-second order principal minors.


Because we avoid doing loops, this method is much faster. For a big project, this added efficiency is worth it. More generally, this technique of using apply() to avoid repeatedly looping is a good lesson to apply to other programming problems.

Update: Thanks to Berend for going through the trouble of system.time() testing the code in this post (and spiceman for a good comment as well). Read on into the comments for more, but for a preview of what we learned: (1) The copying via c() is what slows the loop down, (2) apply is slightly slower than writing the loop yourself, (3) combn(), the combinations() alternative, is really slow, and (4) one should always stand behind system.time() methods before talking about the efficiency of a method.

I much appreciate the feedback. One of the reasons I have this blog is to learn more about R (and those comments were definitely informative).

Thursday, May 19, 2011

Porting Stata-like Marginal Effects to LaTeX

The TimeSeriesIreland Blog posted an excellent start on a function that automatically computes marginal effects for probit and logit models. As I have always wanted an easy-to-use function that computes and reports marginal effects in R, I was elated to see the function and I couldn't wait to use it.

My initial impression when I saw the post was: "I should write an mtable() extension for that to go with my other extensions." With this in mind, I started familiarizing myself with the code and I contacted the author to make sure he was fine with me extending his code (and adding it to my package with mtable() extensions). As he was fine with my goal of extending the function, here is a post where I introduce you to a new extension to mtable().

Important Caveat: At this point, the function does not do the technically "right" thing (delta method) to obtain the standard errors on the marginal effects. Instead, it supposes that the z-score will remain constant across the transformation, which isn't quite right. Even though it isn't perfect, in most of the examples I have tried, the results are almost identical to Stata output. You tend to get more divergence from the Stata solution for dummy variable regressors (where Stata computes a discrete jump rather than a derivative).

One would think that an extension of mfx() would use mfx(), but that didn't turn out to be the easy way to go. After many unsuccessful attempts (more about this in a future post; I learned some things worth sharing), here's the solution I landed on.

First, define an "mfx" object with a function that changes the class attribute of a fitted glm object to. Here's code to define a function to do this.


Second, make sure you have the memisc library loaded with the command library(memisc) -- or library(tonymisc), which loads memisc among other excellent packages.

Third, until I get the kinks worked out and port this into my package, you'll have to run code to define a getSummary.mfx() method to extend mtable. Here's some code that will do this.


Now, I suppose you want to know how this extension works. Here's an example that uses some data from the wonderful Ecdat library (a great source for Econometrics data sets).


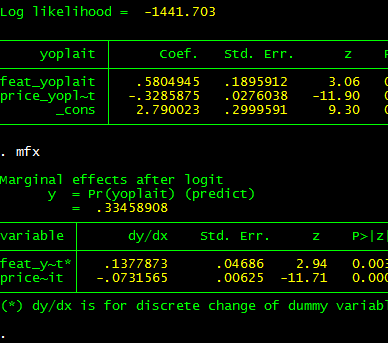
Here's the output to R's console. Note that feat.yoplait is a dummy variable for whether Yoplait had a featured advertisement that particular week. Based on my caveat, you wouldn't expect the output to be identical to Stata.


And, as you can see (compare with Stata output below), it isn't exactly the same, but if you are trying to understand the qualitative importance of your estimates, it isn't too bad.


Two bugs (quirks, kludges) remain: (1) I want to get the standard errors precisely right, (2) I want to convince mtable() to stop reporting the intercept for the marginal effects (as the intercept doesn't change, it can't have a marginal effect!). Even before I get around to this, I hope this code will have a positive marginal effect.

---

Update: The original post to which this post refers is no longer available because the TimeSeriesIreland Blog appears to have been taken down. I leave this post up subject to two caveats: (1) the standard errors are not quite right for the marginal effects and (2) the marginal effects for dummy regressors are not computed for a discrete jump from 0 to 1. Otherwise, you may find this tool useful.

Subject to the caveats in this post, if you want access to this function and a related function that is more summary()-like, I have included it in my CRAN-contributed package tonymisc (see the tab at the top of this page).

Monday, May 9, 2011

Extending mtable() to ivreg, gls and robust standard errors

I have written several extensions of the mtable() command in the memisc library that may come in handy. The methods are available in a package I have written called tonymisc (now, available on CRAN). A zipped folder with my package files is available for download here.

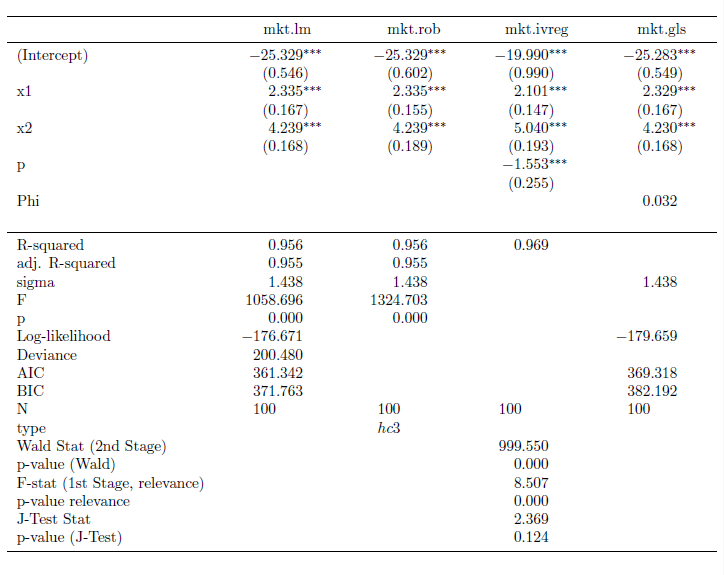
My extensions to mtable() allow users to easily summarize (and port into LaTeX tables) lm() objects with robust standard errors, gls() objects (created using nlme's gls) and ivreg() objects (created using AER's ivreg). If you would like to see how the output looks, here's some example code:


This code produces the LaTeX code behind this table.


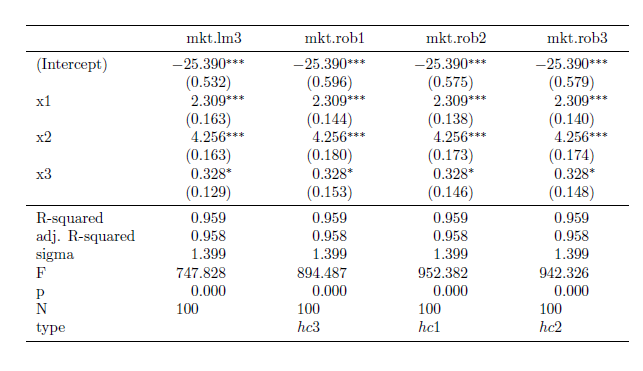
I also implemented a feature through my robust() command to allow the user to select which variables he/she would like to see in the table output. Here's some example code for that feature:


The output from this code is this table:


To get this package to work for you, simply use the command install.packages("tonymisc", dependencies=TRUE), as you would normally do to install packages from CRAN. copy the tonymisc folder (available for download here) into your R library of packages. Once it is in the right place, all you need to do is load it with the library(tonymisc) command.

I am still working on the details of the package (help files, extra features, extensions of what I have done, internal consistency, loading other packages by default, ease of use, etc.), but I would be happy if people find it useful at this stage. In particular, I still need to implement some ideas from the comments (the next version will contain these). If you have other suggestions, please leave a comment to let me know.

Tuesday, May 3, 2011

Putting Robust Standard Errors into LaTeX Tables: An Extension of mtable

I recently discovered the mtable() command in the memisc library and its use with toLatex() to produce nice summary output for lm and glm objects in a nicely formatted table like this:


Once you have your linear model objects, all you need is one command -- a composite of toLatex() and mtable(). Here's the R code I used to generate the LaTeX code:


All you need to do from here is to copy the code into your LaTeX document (or in my case LyX document with evil red text), where you use the dcolumn and booktabs packages (specify this in the preamble using \uspackage{} for each package).

This is really straightforward ... as long as you just want to use lm or glm objects with no deviations from that baseline. But, what if you -- as many econometricians do -- want to estimate your linear model with heteroskedasticity-consistent standard errors?

How to do it with "robust" standard errors

My favorite way to robustify my regression in R is to use some code that John Fox wrote (and I found in an R-help forum). He called it summaryHCCM.lm(). In my own applications, I have renamed it summaryR() because "R" makes me think "robust" and it is fewer keystrokes than HCCM. I modified the output of the code to work better with what follows:


Suppose I would like to produce nicely-typed output like the above table, but with robust standard errors. Unfortunately, the summaryR() solution doesn't map naturally into our mtable() solution to producing nice LaTeX output. But, fortunately, there is a solution.

(If you just want this to work, copy and run all of the code from here to "so we are all set." No need to understand the implementation details. If you're interested in understanding how I arrived at my solution, here come the details)

It turns out that there is a way to map the summaryR() command to the mtable() command to produce nice LaTeX output with robust standard errors. Once we have the commands, the syntax is just as easy as using summaryR() directly and it makes creating LaTeX table output easy. So, what do we do?

First, we need to adapt the methods behind mtable() to allow it to recognize something that I call a "robust" object. To do this, we need to write a function called getSummary.robust()


and we need to set some formatting options using the setSummaryTemplate() command:


Second, we need to convert a linear models object into something called a "robust" object. The robust() command does this:


So, we are all set. If you run all of the preliminary code in this post, you're in good shape to produce LaTeX tables with robust standard errors like this table:


Once the functions are defined, the syntax is straightforward. Here is the code I used to put together the the table (plus, one step to copy the output into my LyX file)


I hope this is helpful. If you're interested in other extensions of mtable(), here's an excellent post.

Finally, I am still learning I learned how to bundle functions into a package (so I haven't made this available as a package yet). Today, I was able to successfully package this set of functions into a package called tonymisc on my computer. Once I organize the help/example/other fun parts of the package, I will see about making this and my extension for ivreg objects available. This package (in its first version) is available on CRAN through install.packages("tonymisc").

Tuesday, April 26, 2011

R Bloggers

I recently found a great resource for R in the blogosphere, the R Bloggers Blog Aggregator. Basically, the site aggregates posts from a bunch of blogs about R (like this one!) into a giant feed of uses for R. If you are interested in learning more about R, the best way is to see how other people interact with it. What better way than to see what the R blogosphere has to say?