Monday, June 20, 2011

Today's Assignment: Assignment

A new R user quickly discovers that there are multiple ways to store information into an object -- the technical term for this is assignment. There's = as in:

x = c(1,2,3)

and there's <- as in:

x <- c(1,2,3)

R help on assignOps offers this explanation of the difference:
The operators <- and = assign into the environment in which they are evaluated. The operator <- can be used anywhere, whereas the operator = is only allowed at the top level (e.g., in the complete expression typed at the command prompt) or as one of the subexpressions in a braced list of expressions.
For catching subtle coding errors with =, this is a smart feature of R. When I am tired, I sometimes find myself writing a line of code that looks like this:

if(codename = "thedoctor") watch = "yes"

In this line of code, the problem is that codename = "thedoctor" isn't a logical statement. It is a statement that would assign the string "thedoctor" to an object called codename.... if the statement were allowed by R's language. Fortunately, R prevents this.

This feature of the R programming language helps me because I -- by default -- use = for assignment rather than <-. My style is not conventional, however. Popular R coding style guides (Google, 4D pie charts) suggest that users use <- option for assignment, rather than =.

Deep down, I think I use this unconventional default because I had the = versus == distinction (more generally, assignment versus logical statement) drilled into me in my first computer science class (not in R; Java). On reflection, I have three reasons to use = rather than <-. First, = is easier to type, using one keystroke and no shift keys. Second, the equals style looks cleaner to me (completely a personal preference). Third, I think assignment should take place out in the open (i.e., exactly where = is allowed). If the line of code is out in the open, both <- and = work the same.

On a final note, the <- is not without its problems for logical statements. For example, the statement

if(agediff<-2) status = "I'm older"


will cause problems and it won't let you know about these problems until you get some really strange results later on. Here's the code from an interactive R session where I show what can go wrong.

> agediff = -3
> if(agediff<-2) status = "I'm older"
> status
[1] "I'm older"
> agediff
[1] 2
> agediff = 4
> if(agediff<-2) status = "I'm older"
> status
[1] "I'm older"
> agediff
[1] 2
> status=NULL
> if(agediff<-2) status = "I'm older"
> status
[1] "I'm older"
> agediff
[1] 2


The problem is two-fold in this code. First, the if statement isn't acting as a logical statement splitting by whether "agediff< -2" Second, the value of agediff is changed because "<-" means assignment. The result is that both status and agediff have (potentially) the wrong values at the end of running the code.

As this error is a problem whether you use = or <- for assignment, it is worth knowing regardless of your style preference. Adhering to good spacing guidelines is a good way to avoid this error.

> agediff = 4
> if(agediff < -2) status = "I'm older"
> status
NULL
> agediff
[1] 4


There are some other examples in the Stack Overflow forum discussion on this topic (actually multiple threads on this), all of which are useful. It is interesting reading to be sure.

Sunday, June 5, 2011

An application of aggregate() and merge()

Today, I encountered an interesting problem while processing a data set of mine. My data have observations on businesses that are repeated over time. My data set also contains information on longitude and latitude of the business location, but unfortunately, my source only started providing the longitude and latitude information in the middle of the data set. As a result, the information is missing for the first few periods for every business, but across businesses, I have latitude and longitude information for virtually all of my data set.

As long as the business hasn't shifted location, this isn't a problem. I can just substitute the lat-long information from the later periods into the earlier periods for each business. This sounds simple enough to do, but when one has a data set with 70,000 observations, an automatic process saves a lot of time and can help avoid mistakes.

Let's start by building common ground. Here is a script that you can use to simulate a data set to follow along.


Once you run this script, the data frame mydat is a balanced panel of 125 businesses observed over 25 time periods (my actual data set is an unbalanced panel and the solution I present works just as well for unbalanced as with balanced. It is just easier to simulate a balanced panel). Each observation has a business identifier (BusID), a time period identifier (per), as well as simulated data on latitude and longitude.

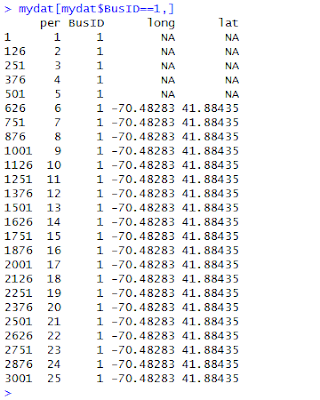
To see the problem with this data set, examine the data for the first business using the command mydat[mydat$BusID==1,]. Here's a screenshot of the output.


This problem occurs throughout the data set and we would like to just substitute the lat-long values we have for the right missing ones.

How did I solve my NA problem? I used aggregate(), a function that quickly and conveniently collapses a data frame by a factor or list of factors. With aggregate(), you can take the mean, compute the max, compute the min, sum the values or compute the standard deviation by the levels of the collapsing factor. The aggregate() function also has a na.rm option that allows us to easily ignore the NA values (useful here). In our example, we could collapse by taking the mean or computing the max or the min; the result will be the same because latitude and longitude do not vary for the same business over time.

Let's collapse by taking the mean withing each level of BusID. The result of my use of aggregate() is a data frame that upon merging with the original data frame (using merge()), fills in the missing latitude and longitude values. The following code implements this strategy to fill in the NAs in our simulated data set.


Before leaving you to have fun with aggregate() and merge(), several points are worth mentioning.

First, the aggregate() function requires that the collapsing factor(s) is (are) stored in a list. This is why the code uses list(BusID=mydat$BusID) when mydat$BusID would seem more natural. The list() part is necessary to get aggregate() to work.

Second, it is useful for merging in the second step to give the attribute in the list the same name as the variable name in the original data frame. The BusID= part of the list(BusID=mydat$BusID) command is a convenient way to prepare the resulting data frame for merging.

Third, my code uses -c(3,4) to drop the 3rd and 4th columns of the original data frame (the ones with the original lat-long data) before merging it with the collapsed latlong data frame. This is important so that the merge() command doesn't get confused about which columns to use for matching. If you leave these columns in mydat, R's merge will try to match the values in those columns as well (because they have a common name with those columns in latlong).

Finally, the data in this example are in a different order now that we merged on BusID. If this bothers you, you can use order to sort the data set by time period as in

myfinaldat=mycleandat[order(mycleandat$per),]

As this last step is purely a cosmetic change to the data set that will not affect subsequent analyses, you can leave it out.

Although this example was my solution to a rather specific problem, it illustrates how to use some useful commands. To the extent that these commands are widely applicable to other problems, I hope you find uses for these commands in related applications.