Showing posts with label data. Show all posts

Sunday, June 5, 2011

An application of aggregate() and merge()

Today, I encountered an interesting problem while processing a data set of mine. My data have observations on businesses that are repeated over time. My data set also contains information on longitude and latitude of the business location, but unfortunately, my source only started providing the longitude and latitude information in the middle of the data set. As a result, the information is missing for the first few periods for every business, but across businesses, I have latitude and longitude information for virtually all of my data set.

As long as the business hasn't shifted location, this isn't a problem. I can just substitute the lat-long information from the later periods into the earlier periods for each business. This sounds simple enough to do, but when one has a data set with 70,000 observations, an automatic process saves a lot of time and can help avoid mistakes.

Let's start by building common ground. Here is a script that you can use to simulate a data set to follow along.


Once you run this script, the data frame mydat is a balanced panel of 125 businesses observed over 25 time periods (my actual data set is an unbalanced panel and the solution I present works just as well for unbalanced as with balanced. It is just easier to simulate a balanced panel). Each observation has a business identifier (BusID), a time period identifier (per), as well as simulated data on latitude and longitude.

To see the problem with this data set, examine the data for the first business using the command mydat[mydat$BusID==1,]. Here's a screenshot of the output.
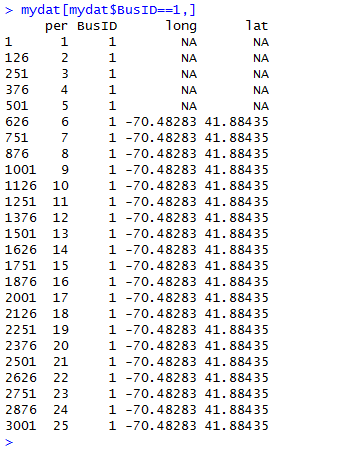


This problem occurs throughout the data set and we would like to just substitute the lat-long values we have for the right missing ones.

How did I solve my NA problem? I used aggregate(), a function that quickly and conveniently collapses a data frame by a factor or list of factors. With aggregate(), you can take the mean, compute the max, compute the min, sum the values or compute the standard deviation by the levels of the collapsing factor. The aggregate() function also has a na.rm option that allows us to easily ignore the NA values (useful here). In our example, we could collapse by taking the mean or computing the max or the min; the result will be the same because latitude and longitude do not vary for the same business over time.

Let's collapse by taking the mean withing each level of BusID. The result of my use of aggregate() is a data frame that upon merging with the original data frame (using merge()), fills in the missing latitude and longitude values. The following code implements this strategy to fill in the NAs in our simulated data set.


Before leaving you to have fun with aggregate() and merge(), several points are worth mentioning.

First, the aggregate() function requires that the collapsing factor(s) is (are) stored in a list. This is why the code uses list(BusID=mydat$BusID) when mydat$BusID would seem more natural. The list() part is necessary to get aggregate() to work.

Second, it is useful for merging in the second step to give the attribute in the list the same name as the variable name in the original data frame. The BusID= part of the list(BusID=mydat$BusID) command is a convenient way to prepare the resulting data frame for merging.

Third, my code uses -c(3,4) to drop the 3rd and 4th columns of the original data frame (the ones with the original lat-long data) before merging it with the collapsed latlong data frame. This is important so that the merge() command doesn't get confused about which columns to use for matching. If you leave these columns in mydat, R's merge will try to match the values in those columns as well (because they have a common name with those columns in latlong).

Finally, the data in this example are in a different order now that we merged on BusID. If this bothers you, you can use order to sort the data set by time period as in

myfinaldat=mycleandat[order(mycleandat$per),]

As this last step is purely a cosmetic change to the data set that will not affect subsequent analyses, you can leave it out.

Although this example was my solution to a rather specific problem, it illustrates how to use some useful commands. To the extent that these commands are widely applicable to other problems, I hope you find uses for these commands in related applications.

Sunday, April 24, 2011

Merging Multiple Data Files into One Data Frame

We often encounter situations where we have data in multiple files, at different frequencies and on different subsets of observations, but we would like to match them to one another as completely and systematically as possible. In R, the merge() command is a great way to match two data frames together.

Just read the two data frames into R


mydata1 = read.csv(path1, header=T)
mydata2 = read.csv(path2, header=T)


Then, merge

myfulldata = merge(mydata1, mydata2)

As long as mydata1 and mydata2 have at least one common column with an identical name (that allows matching observations in mydata1 to observations in mydata2), this will work like a charm. It also takes three lines.

What if I have 20 files with data that I want to match observation-to-observation? Assuming they all have a common column that allows merging, I would still have to read 20 files in (20 lines of code) and merge() works two-by-two... so I could merge the 20 data frames together with 19 merge statements like this:

mytempdata = merge(mydata1, mydata2)
mytempdata = merge(mytempdata, mydata3)
.
.
.
mytempdata = merge(mytempdata, mydata20)


That's tedious. You may be looking for a simpler way. If you are, I wrote a function to solve your woes called multmerge().* Here's the code to define the function:

multmerge = function(mypath){
filenames=list.files(path=mypath, full.names=TRUE)
datalist = lapply(filenames, function(x){read.csv(file=x,header=T)})
Reduce(function(x,y) {merge(x,y)}, datalist)


After running the code to define the function, you are all set to use it. The function takes a path. This path should be the name of a folder that contains all of the files you would like to read and merge together and only those files you would like to merge. With this in mind, I have two tips:
  1. Before you use this function, my suggestion is to create a new folder in a short directory (for example, the path for this folder could be "C://R//mergeme") and save all of the files you would like to merge in that folder.
  2. In addition, make sure that the column that will do the matching is formatted the same way (and has the same name) in each of the files.
Suppose you saved your 20 files into the mergeme folder at "C://R//mergeme" and you would like to read and merge them. To use my function, you use the following syntax:

mymergeddata = multmerge("C://R//mergeme")

After running this command, you have a fully merged data frame with all of your variables matched to each other. Of course, most of the details in matching and merging data come down to making sure that the common column is specified correctly, but given that, this function can save you a lot of typing.

*Maybe a function like this exists out there already, but I think it is entertaining to write helpful functions. I also trust the functions more if I write them myself and test them on my own problems.

Saturday, April 23, 2011

Dates in R and the First Day of the Month

I spent some time this morning learning about how R thinks about dates in R. I found this website to be a useful guide.

Imagine that your data are dates in a standard format [YEAR-MONTH-DAY (as in 2011-23-04) is one such format] and you want a vector of the dates that are the first day in the month of your data set. You might, for example, be interested in this (as an intermediate calculation) because you wish to match some S&P 500 returns data to monthly data. Frustratingly, the S&P 500 returns data do not report on the weekends or on holidays when the exchange is closed.

Here's a function that will do return a vector of first-days-of-the-month if you give it a vector of dates. Maybe you will find this useful.


Enjoy!

Tuesday, March 1, 2011

Data from last post

Posting the code I used in the last post wasn't that useful unless I also posted the data set. Here's the data. These are made up data, but it is a nice data set for illustrating how to conduct a regression. Enjoy!

Thursday, February 24, 2011

How to read and write Stata data (.dta) files into R

Here's an R tutorial where I explain how to read Stata data files into R (even if you don't own the program Stata). I also offer some other basic tips.


Of note, you can also write Stata .dta files from R (if your coauthors or journals insist on having ".dta" data).

Suppose your R data frame has the name fuzzybunny and you want to save the file to the C: drive as myfuzzydata.dta. After loading the foreign library,

library(foreign)

Here's the syntax:


write.dta(fuzzybunny, "C://myfuzzydata.dta")

Try it out and impress your friends (you know, the friends who only know how to use Stata).

Tuesday, February 22, 2011

An R Video Tutorial on Entering Data

Here is a video tutorial on entering and manipulating data in R. I plan to do more of these. If you have some suggested topics, let me know in the comments.

Tuesday, May 11, 2010

Summary Statistics in R

There are plenty of useful techniques for manipulating data frame objects in R. This post summarizes some of these useful techniques, and gives code to implement them. Before running the code in this post, you should read in the data set (which is available for download here). For tips on how to read Stata ".dta" files into an R data frame, see my previous post.
## Print the entire data frame to the screen by typing its name ##

caschool.df

## Look just as the variable names ##

names(caschool.df)

## Examine a particular variable using the $ extractor ##

caschool.df$testscr

## You can also think of the data frame as a matrix ##

caschool.df[,4] ## Extracts the 4th column
caschool.df[4,] ## Extracts the 4th observation
caschool.df[4,4:18]

## The last command extracts the 4th through 18th columns
## of the 4th observation.
##
## Note 4:18 is R shorthand for
## c(4,5,6,7,8,9,10,11,12,13,14,15,16,17,18)

## Compute summary statistics on the entire data frame ##
## or just one variable ##

mean(caschool.df) ## Returns NA for categorical
round(mean(caschool.df),2) ## Rounding returns easier
## to read formatting
var(caschool.df) ## Returns var-cov matrix
diag(var(caschool.df)) ## Returns just the variances
mean(caschool.df$testscr) ## Returns mean of testscr
var(caschool.df$testscr) ## Returns scalar variance

## Compute the summary statistics on columns 6 through 18 ##

mean(caschool.df[,6:18])
var(caschool.df[,6:18]) ## Returns var-cov matrix

## If you don't like typing the data frame's name every ##
## time you want to explore the variable, you can use ##
## the attach() command.

attach(caschool.df)

## Now, the variables in the data frame can be accessed ##
## without extracting them with the $

mean(testscr)


##-------------------------------------------------- ##
## Creating/Storing new variables ##
## Just using arithmetic definition of new variables ##
##-------------------------------------------------- ##

math_read_avg = (read_scr+math_scr)/2

## -------------------------------------------##
## You can attach it to the data frame ##
## In fact, for regression, you want to do so ##
## -------------------------------------------##

caschool.df=cbind(caschool.df,math_read_avg)

## -------------------------------------------------##
## ... and its name will be what you called it when ##
## you defined the variable ##
## -------------------------------------------------##

names(caschool.df)
caschool.df$math_read_avg

## ------------------------------------------------- ##
## Too many datasets in R's active memory can cause
## problems math_scr might be a variable name in
## multiple data frames ... especially if you work
## with a lot of data sets
##
## In case of ambiguity, R will write over the old
## variable name with the new definition.
##
## To avoid this problem, when you are done with an
## attached data set, you should use detach()
## ------------------------------------------------ ##

detach(caschool.df)

## ------------------------------------------------ ##
## An added note: I like to leave my workspace image
## clutter-free. After working on some code, I save
## my code in a text file, but I do *not* save my
## workspace image.
##
## Following this practice can help you avoid
## referencing a variable name that you created months
## ago for a separate project
## ------------------------------------------------ ##

Reading in data in R

Reading in data can be a chore in R if you haven't done it before. In this post, I describe how to read data into R's most common data object -- the data frame.

## ----------------------------------------------------##
## The most basic structure in R is a data frame. The ##
## goal here is to read data from some external source ##
## into an R data frame ##
## ----------------------------------------------------##

## --------------------------------------------------- ##
## The standard space-delmited function is read.table()##
## ##
## To read in the data, you will want to save the file ##
## to a known directory. For me, this is "C:/R/" ##
## ##
## Time saving note: these commands sometimes require ##
## double backspaces in the file path. So, even if I ##
## saved my file at "C:/R/data.txt" I tend to type ##
## "C://R//data.txt" ##
## --------------------------------------------------- ##

## No header is default ##
traffic.df = read.table("C://R//traffic.txt")
traffic.df ## Display the data frame

## How to tell R to store variable names ##
traffic.df = read.table("C://R//traffic.txt",header=T)

## --------------------------------------------------- ##
## A common difficulty is that the basic command does ##
## not read in Excel Workbook files. For this, there ##
## are a couple of workarounds. My favorite is to ##
## use read.csv(). ##
## --------------------------------------------------- ##

## First, save your Excel file as type "csv"
## Second, use a command like the following:

insulin.df = read.csv("C://R//insulin.csv", header = T)

##----------------------------------------------------##
## Suppose you want to read in an Stata .dta file ##
## The command is read.dta(). ##
## ##
## This requires loading a package. ##
## In this case, the "foreign" library. ##
## ##
## Because external packages are not part of the base ##
## group of packages, you'll have to tell R to use ##
## them with the command library() ##
##----------------------------------------------------##

library(foreign)

caschool.df = read.dta("C://R//caschool.dta")

------------------------------------------------------
If you came across this page looking for advice on how to read data into R, you likely have a data set that you want to use. If you want to use some of the data referenced in this post, the traffic data set is here (just copy and paste into Notepad, and save to your favorite directory):


density speed
20.4 38.8
27.4 31.5
106.2 10.6
80.4 16.1
141.3 7.7
130.9 8.3
121.7 8.5
106.5 11.1
130.5 8.6
101.1 11.1
123.9 9.8
144.2 7.8
29.5 31.8
30.8 31.6
26.5 34.0
35.7 28.9
30.0 28.8
106.2 10.5
97.0 12.3
90.1 13.2
106.7 11.4
99.3 11.2
107.2 10.3
109.1 11.4