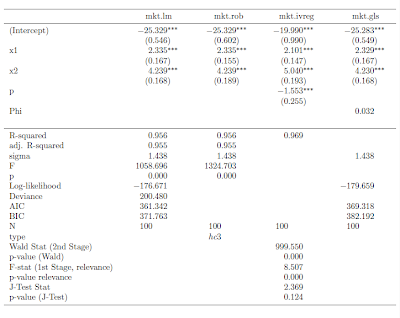
My extensions to mtable() allow users to easily summarize (and port into LaTeX tables) lm() objects with robust standard errors, gls() objects (created using nlme's gls) and ivreg() objects (created using AER's ivreg). If you would like to see how the output looks, here's some example code:
This code produces the LaTeX code behind this table.

I also implemented a feature through my robust() command to allow the user to select which variables he/she would like to see in the table output. Here's some example code for that feature:
The output from this code is this table:

To get this package to work for you, simply use the command install.packages("tonymisc", dependencies=TRUE), as you would normally do to install packages from CRAN.
I am still working on the details of the package (help files, extra features, extensions of what I have done, internal consistency, loading other packages by default, ease of use, etc.), but I would be happy if people find it useful at this stage. In particular, I still need to implement some ideas from the comments (the next version will contain these). If you have other suggestions, please leave a comment to let me know.

If you want to cover them all: the plm package could also be interesting :-)
ReplyDeleteThanks for your work: even if I'm currently not into regressions your code will come in handy when I have to build such things for other output!
Hello Tony,
ReplyDeleteFeel free to include my code for cox and lme4 models in your package. It's rough, but should work well enough to get people started. I hope to get them cleaned up in the near future, but I have some other things I need to get taken care of first.
@Jan Nice suggestion. Taking a look at it, that wouldn't be too hard to implement. Do you have suggestions for what summary statistics you would like to see reported?
ReplyDelete@Jason Thanks! Next time I sit down with it, I will take you up on that offer (and, of course, give credit in the documentation).